Transport equity is a constant concern by geographers, urban planners, and sociologists. Although the federal government of the U.S. has prioritized equity of accessibility by enacting its Ladders to Opportunity Program to ensure that our transportation system will simultaneously expand economic opportunity and socioeconomic mobility (U.S. Department of Transportation, 2016), transportation-related social exclusion can persist in numerous ways. Many are interested in this controversial question: will the prevalence of information and communication technologies (ICTs) strengthen social exclusion and inequality, causing more digital divide, or will it mitigate some long-lasting sociospatial inequality?
How should we measure and understand the accessibility of ICT-enabled transportation? When searching for the answers, we took ride-sharing systems as an example, and explored the spatial disparities of accessibility in the city of Atlanta using both UberX (the most popular Uber product) and UberBLACK (the premium Uber product) data.
Uber Accessibility
We applied spatial regression models to explore empirical relationships between socioeconomic disparities and Uber accessibility.
Findings:
- Wealth or race does not have significant associations with Uber accessibility.
- Higher road network density, population density, and less commuting time to work correlate with greater Uber accessibility.
- More public transport stops are related to better accessibility of UberX but worse accessibility of UberBLACK.
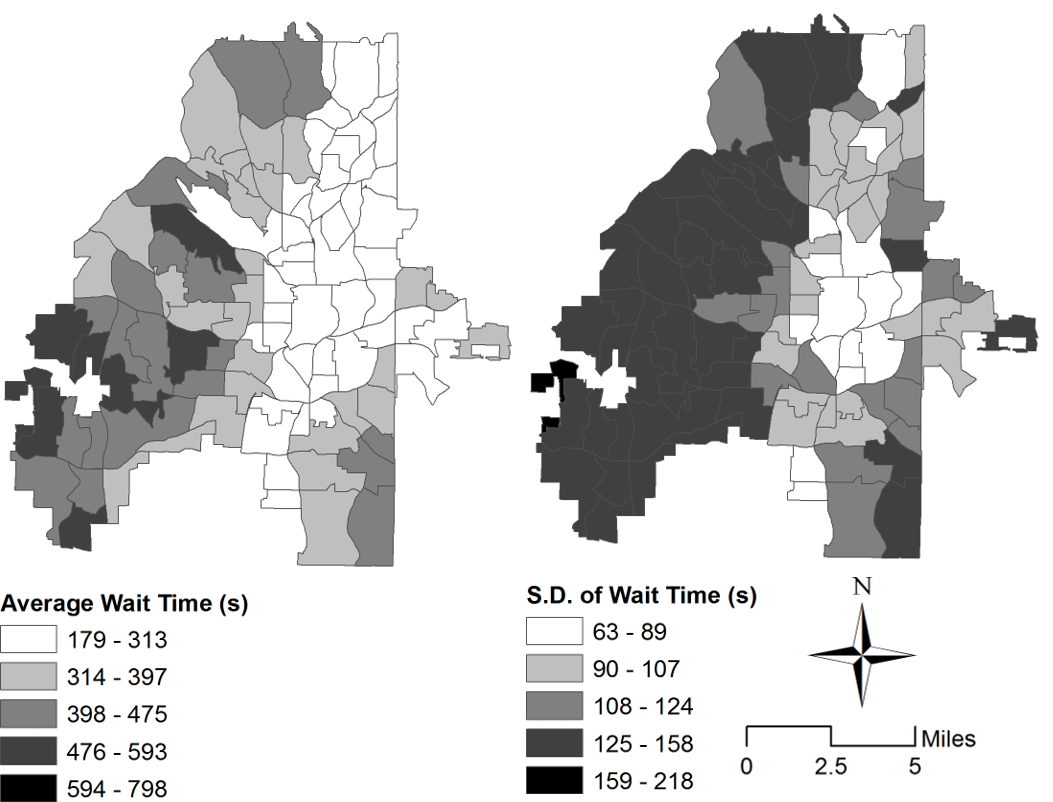
The average wait times (left) and the standard deviation of wait times (right) for UberX:
References
- Mingshu Wang, Lan Mu. (2018).Spatial disparities of Uber accessibility: An exploratory analysis in Atlanta, USA. Computers, Environment and Urban Systems, 67, 169-175.
- Mingshu Wang, Zheyan Chen, Lan Mu, Xuan Zhang. (2020).Road network structure and ride-sharing accessibility: A network science perspective. Computers, Environment and Urban Systems, 80, 101430.