Since 2007, China has become the nation with the highest amount of CO2 emissions. Aiming at contributing to the global emission reduction goals while sustaining the country’s economic development, the Chinese government has adopted advancing the development of low-carbon cities. More recently, at the 4th Central Government Urban Conference (2015), China’s leadership reiterated the importance of the pursuit of compact, efficient, and environmentally friendly urban development.
Although existing GHG emission reduction strategies rely on technological solutions (e.g., renewable energy and zero-carbon buildings) and market-based approaches (e.g., carbon trading), they are oftentimes unable to reach carbon reduction goals by themselves. Similarly, smart city initiatives call for an integrated approach to sustainability, emphasizing the idea that technology is not enough”. Indeed, a growing body of literature has identified that urban forms can be used as a supplementary emission reduction strategy.
Since the late 1990s, research has highlighted the role of urban forms, including polycentric urban form and compact urban form, in fostering sustainable development. Therefore, in this project, we explored the relationship between urban forms (e.g., polycentricity, compactness, size, wealth, density) and CO2 emissions in over 100 Chinese cities based on multi-sourced data. Before empiricallytesting any relatioship, we had to find data for/in China.
Carbon Emission Data for China
There are three gridded CO2 datasets available for China, namely the Emission Database for Global Atmospheric Research (EDGAR), the Fossil Fuel Data Assimilation System (FFDAS), and the China High Resolution Emission Gridded Data (CHRED). Additionally, National Bureau of Statistics of China (NBSC) provides energy statistics at province level.
| Data | Temporal Span | Spatial Resolution | Spatial Coverage |
|---|---|---|---|
| EDGAR | 1970–2012 | 0.1° × 0.1° | Global |
| FFDAS | 1997–2011 | 0.1° × 0.1° | Global |
| CHRED | 2007, 2012 | 10 km × 10 km, 1 km× 1 km | China |
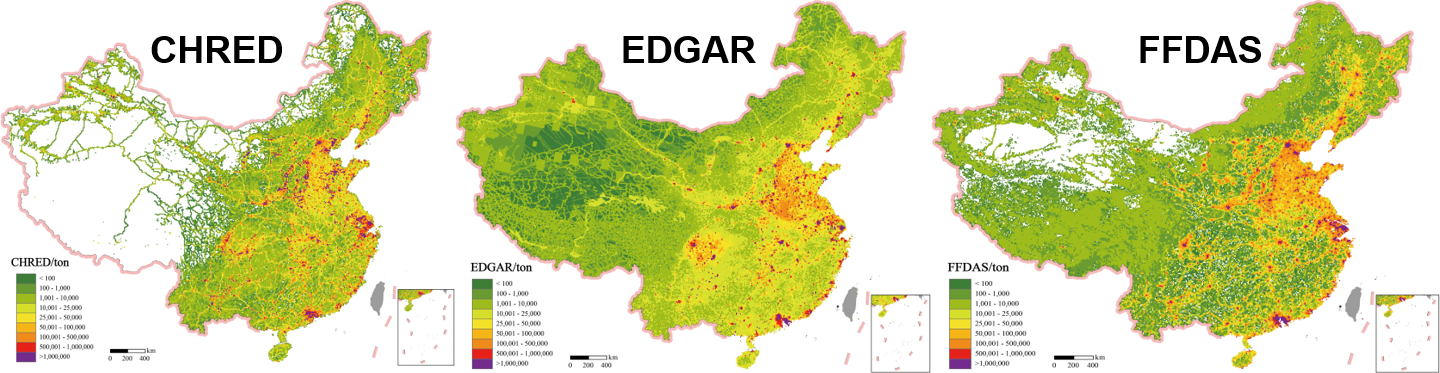 Three gridded CO2 datasets of China, in 2007
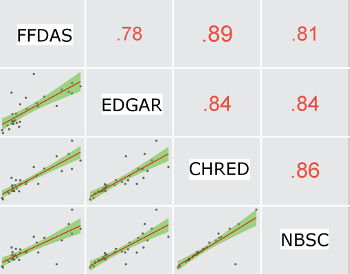
Correlation coefficient (Pearson’s r) at province level (N=30):
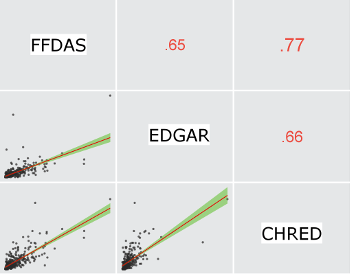
Correlation coefficient (Pearson’s r) at prefecture city level (N=340):
Urban Forms VS CO2 emissions
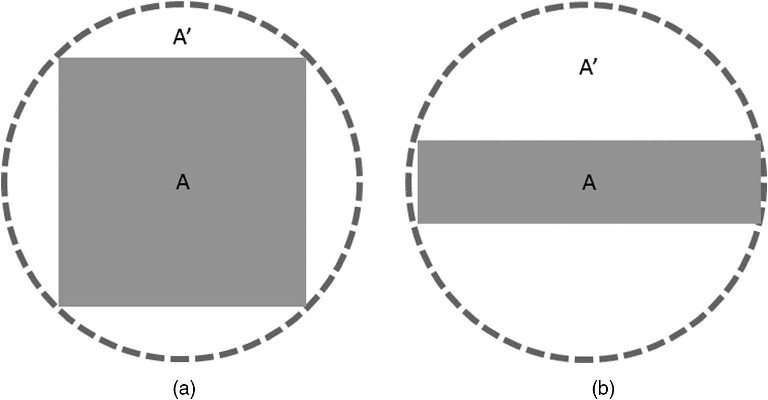
Conceptualization of compactness
- A = the area of the gray square (rectangle); A’ = the area of the dotted circle
- More compact (a) and Less compact (b) urban form
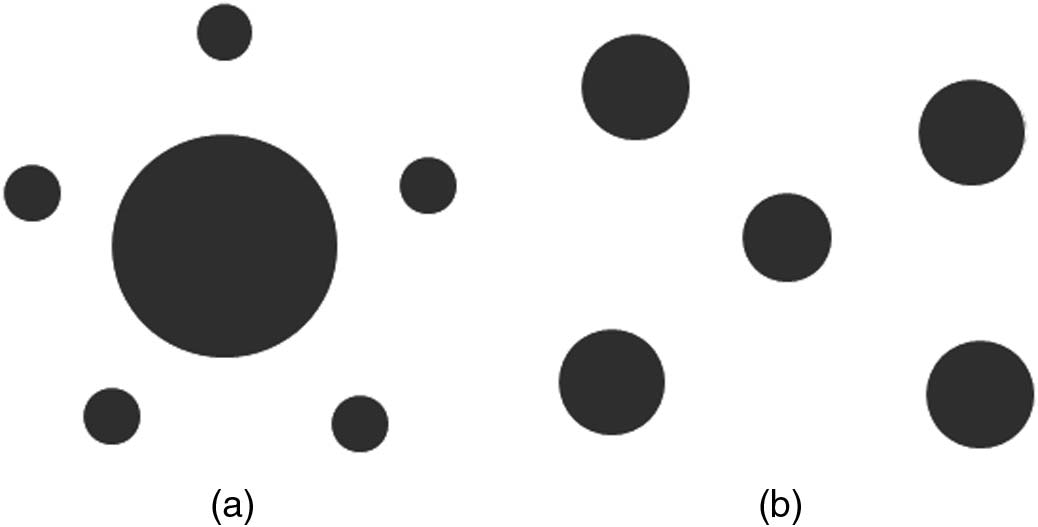
Conceptualization of polycentricity
- Each solid circle refers to a subdivision of a city; the relative area of the circle denotes the relative population size of that subdivision
- A less polycentric urban systems (a) and a more polycentric urban systems (b)
Results
- Polycentric urban form is associated with more CO2 emissions.
- Compact urban form is associated with less CO2 emissions.
- Larger cities are more energy efficient (economies of scale).
- There is a substantial wealth effects on carbon emissions.
References
- Mingshu Wang, Marguerite Madden, Xingjian Liu. (2017).Exploring the Relationship between Urban Forms and CO2 Emissions in 104 Chinese Cities. Journal of Urban Planning and Development, 4, 04017014.
Mingshu Wang, Bofeng Cai. (2017). A two-level comparison of CO2 emission data in China: Evidence from three gridded data sources Journal of Cleaner Production, 148, 194-201.
Mingshu Wang, Bofeng Cai. (2017). A two-level comparison of CO2 emission data in China: Evidence from three gridded data sources Journal of Cleaner Production, 148, 194-201.
Liu, X., Wang, M., Qiang, W., Wu, K. & Wang, X. (2020). Urban form, shrinking cities, and residential carbon emissions: Evidence from Chinese city-regions. Applied Energy, 261, 114409.